
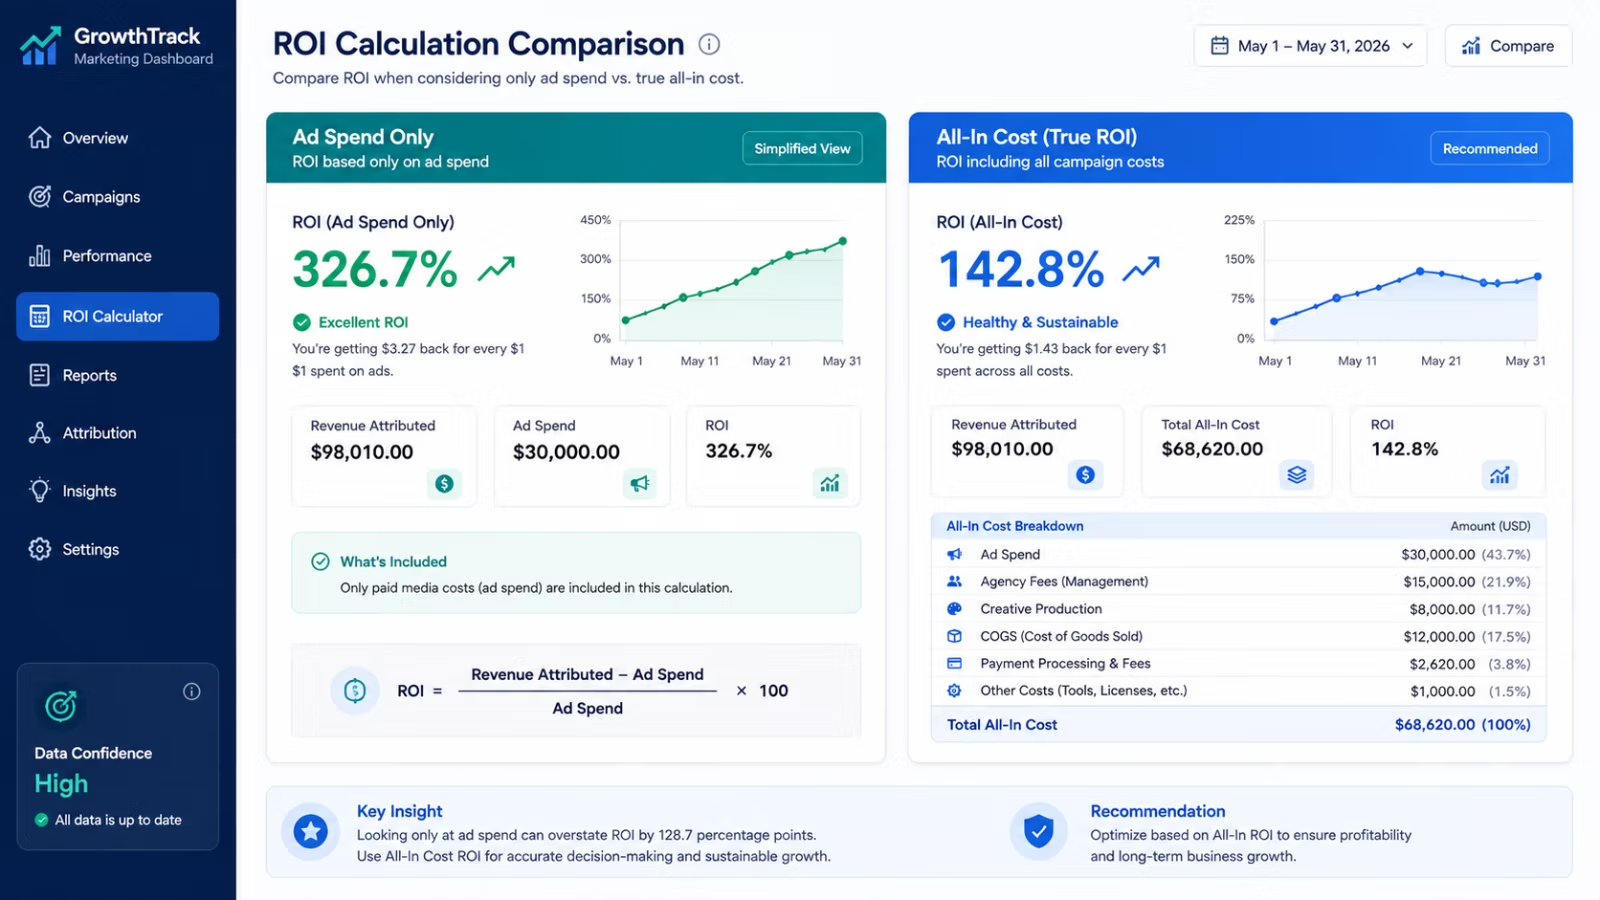
To calculate PPC ROI accurately, you need more than a simple comparison between revenue and ad spend. The standard pay per click ROI formula, whether you call it PPC ROI, CPC ROI, or paid search ROI, has one persistent problem: most accounts apply it to the wrong number.
Ad spend goes in the denominator instead of all-in cost, and the result looks cleaner than reality. Across the healthcare PPC campaigns we have managed, the gap between “ad spend ROI” and “all-in ROI” has consistently been significant enough to change campaign decisions.
Find out where your ad budget is leaking
A twenty four point walkthrough of your Google Ads and Meta Ads accounts, built to surface wasted spend and campaigns worth scaling.
This guide covers both the standard formula and the LTV-adjusted version, a free interactive calculator, and 2026 benchmarks drawn from real campaign data in the healthcare vertical.
Benchmarks in other industries, including e-commerce, SaaS, and professional services, will differ materially; the healthcare figures here are specific to that vertical.
Who this guide is for: Marketers and founders who already know what PPC ROI is and want the formula applied correctly. If you need a primer on how Google Ads works before tackling ROI, the How Google Ads Work guide covers that foundation.
The PPC ROI Formula
PPC ROI, sometimes also referred to as cpc roi or paid search roi, measures profit generated by paid advertising relative to its full cost. The standard formula:
PPC ROI Formula: ROI = ((Revenue from PPC – Total Costs) / Total Costs) x 100
A result of 200% means you returned Rs 3 (or $3) for every Rs 1 (or $1) spent. A result of 0% is break-even. Negative means the campaign is running at a loss before you account for anything else.
What Actually Belongs in “Total Costs”
[SKYMOON INFOTECH ANALYSIS] Across the healthcare PPC campaigns Skymoon has managed, undercounting total costs is the most consistent error we see when accounts report their own ROI.
Ad spend alone typically understates true campaign cost. The cost stack below reflects what a fully-loaded calculation requires.
| Cost Category | What to Include | Often Missed? | Note |
|---|---|---|---|
| Ad Spend | Google Ads, Meta, Microsoft Ads — all platforms | Rarely | The only cost most accounts include in the denominator |
| Agency / Management Fee | Monthly retainer or percentage of spend | Frequently | Including this alone changes the ROI figure substantially |
| Creative Production | Ad copy, design, video production per quarter | Frequently | Often absorbed into agency fee but should be itemised |
| Landing Page Tools | Unbounce, Webflow, conversion-rate tools | Often | Especially relevant for high-traffic campaigns |
| Analytics and Attribution | GA4 setup, heatmaps, call tracking, attribution tools | Often | Frequently categorised as an IT cost, not campaign cost |
| In-House Labor | Hours spent on strategy, reporting, creative review | Almost always | The most consistently omitted cost across accounts we audit |
| Cost of Goods Sold (COGS) | Product cost, fulfillment, returns (e-commerce) | Excluded by most e-commerce accounts | Without COGS, ROI is calculated on revenue, not profit |
[SKYMOON INFOTECH ANALYSIS] In the Google Ads accounts we audit for new clients, the most common gap between the reported CPA and the actual all-in CPA is the omission of agency fees, tool costs, and internal labour from the denominator. WordStream benchmark data (2026) shows the all-industry average CPL is $66.69; that figure covers ad spend only, not total acquisition cost.
A rule of thumb for total-cost CPA in agency-managed accounts: add 25-40% to the platform-reported CPA to account for management fees, tools, and labour. The gap is largest in accounts with high manual management hours and smallest in heavily automated Performance Max accounts.
PPC ROI Calculation: Worked Examples in USD, GBP, and INR
Example 1: US E-commerce Campaign (USD)
A Google Ads campaign for a US direct-to-consumer brand:
| Input | Value | Note |
|---|---|---|
| Ad Spend | $5,000/month | Across Google Search + Shopping |
| Management Fee | $1,000/month | Agency at 20% of spend |
| Creative + Tools | $500/month | Design and landing page tool |
| Revenue Generated | $20,000 | Tracked in GA4 with conversion values |
| COGS (50% margin product) | $10,000 | Half of revenue for product cost and fulfillment |
| Total Costs | $16,500 | All-in denominator |
All-In ROI: ROI = (($20,000 – $16,500) / $16,500) x 100 = 21.2%
The same campaign on ad spend alone: $20,000 revenue / $5,000 spend = 300% ROAS, which the platform will report as a success. The all-in ROI of 21.2% is a very different signal for scaling decisions. This gap is why ROAS and ROI answer different questions.
Example 2: India B2B Services (INR)
| Input | Value | Note |
|---|---|---|
| Ad Spend | Rs 1,00,000/month | Google Search |
| Management Fee | Rs 20,000/month | Agency fee |
| Revenue from Closed Leads | Rs 4,50,000 | CRM-attributed closed revenue |
| Total Costs | Rs 1,20,000 | Ad spend + management |
All-In ROI (INR): ROI = ((Rs 4,50,000 – Rs 1,20,000) / Rs 1,20,000) x 100 = 275%
Example 3: UK Lead Generation (GBP)
For those asking how to measure ppc roi london uk or any UK-based campaign, the formula is identical but currency and typical benchmarks differ. A healthcare-adjacent professional services campaign in London:
All-In ROI (GBP): Ad Spend: £3,000 | Agency: £800 | Revenue: £12,500 -> ROI = ((£12,500 – £3,800) / £3,800) x 100 = 228.9%
Free PPC ROI Calculator
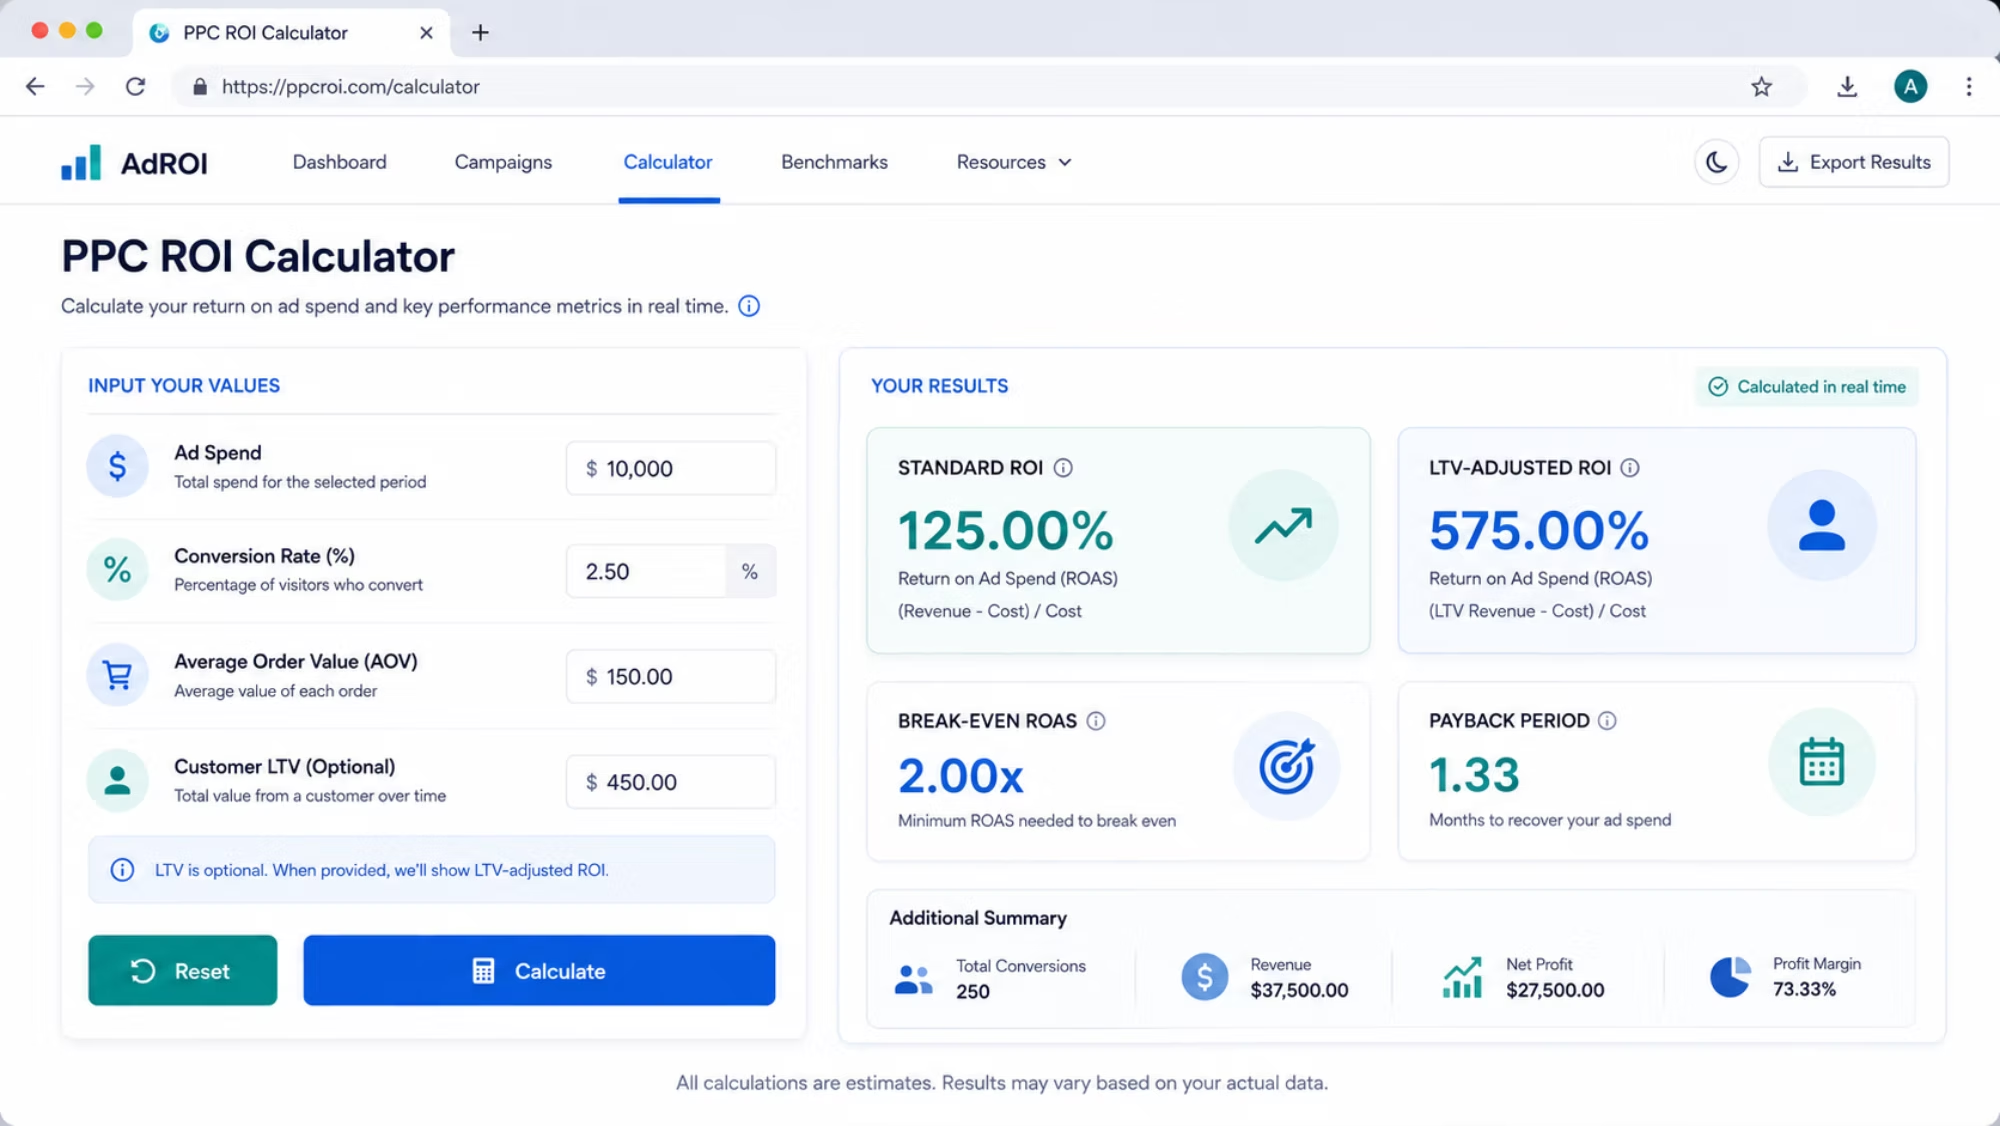
This ppc roi calculator and pay per click roi calculator serves both standard and LTV-adjusted calculations. Enter your numbers below and results update in real time.
See how your results compare to industry averages.
Advanced Customer Economics
Attributed revenue vs. ad spend. Excludes operating expenses, agency fees, and other costs.
Ad spend divided by estimated conversions.
Benchmarks are industry averages. Results vary by geography, targeting, ad quality, and competition level.
These calculations are estimates. Actual PPC profitability depends on margins, agency fees, salaries, platform costs, operating expenses, attribution methodology, and other business factors.
LTV-based results are only as reliable as your LTV estimate and the period over which that revenue is realised.
For a quick manual estimate of the break-even ROAS from your margin. Note that ecommerce ppc roi calculator needs differ from B2B lead-gen: e-commerce inputs use AOV and COGS margin, while lead-gen uses average deal value and close rate. The calculator handles both modes:
Break-even ROAS Formula: Break-even ROAS = 1 / Gross Margin | Example: At 40% gross margin, break-even ROAS = 1 / 0.40 = 2.5x (or 250%). Any ROAS below 250% at 40% margin means the campaign loses money on margin before overhead.
PPC ROI Formula with Customer Lifetime Value (LTV-Adjusted Method)
The standard formula assumes each customer is worth exactly what they spend in their first transaction. For subscription, SaaS, and repeat-purchase businesses, this systematically undercounts the return from paid acquisition.
The question “how does google ads roi calculation using customer lifetime value conversion rate cpc” work is one of the most GSC-confirmed queries on this topic, and the answer requires a different formula entirely.
Relying on single-sale ROI for a repeat-purchase business produces a decision to underspend on acquisition that costs far more in foregone lifetime value than it saves in ad budget.
LTV-Adjusted ROI Formula: ROI = ((Conversions x LTV) – Total Costs) / Total Costs x 100 | Where: Conversions = Clicks x CVR | LTV = AOV x Purchase Frequency x Customer Lifespan x Gross Margin
LTV-Adjusted Worked Example: SaaS Subscription (USD)
| Input | Value | Calculation |
|---|---|---|
| Monthly Ad Spend | $8,000 | Campaign budget |
| Management Fee | $1,500 | 18.75% of spend |
| CPC | $4.00 | 2,000 clicks generated |
| Conversion Rate | 3% | 60 new customers acquired |
| First-Month Revenue | $5,940 | 60 x $99 subscription |
| Total Costs (Month 1) | $9,500 | Spend + fee |
Standard ROI (Month 1 only): ROI = (($5,940 – $9,500) / $9,500) x 100 = -37.5% — Campaign appears to be losing money
Now apply the LTV adjustment:
| LTV Input | Value | Note |
|---|---|---|
| Average Monthly Subscription | $99 | After any discounts |
| Average Customer Lifespan | 18 months | Based on your churn rate |
| Gross Margin | 80% | SaaS typical range |
| LTV per Customer | $1,425.60 | $99 x 18 x 0.80 |
LTV-Adjusted ROI: ROI = ((60 x $1,425.60) – $9,500) / $9,500 x 100 = ($85,536 – $9,500) / $9,500 x 100 = 800.4%
The same campaign that looks like a 37.5% loss on a first-purchase basis produces an 800% LTV-adjusted return. Decisions made only on the standard formula would pause a highly profitable customer acquisition engine.
[SKYMOON INFOTECH ANALYSIS] In the healthcare campaigns we have managed, this dynamic appears in a more compressed form. A patient who starts as an online consultation lead (first conversion value: Rs 1,200-2,000) and progresses to surgery (second conversion value: Rs 5L-8L) produces an LTV that is 250 to 400 times the first-touch revenue.
Are your ad campaigns paying for themselves?
A large share of Google and Meta ad budgets goes to campaigns that quietly underperform. Our free review shows you what to cut and what to scale.
Get My Free Ads ReviewNo commitment, just a clear picture of where you stand.
Standard first-conversion ROI calculations miss this entirely. This is why the LTV-adjusted formula is not optional for healthcare, medical, or any high-ticket service business.
How to Calculate Google Ads ROI Using CLV, CPC, and Conversion Rate
The exact query “how to calculate google ads roi using clv cpc conversion rate” describes the LTV-adjusted method. The calculation uses three inputs that link your ad account data to lifetime customer value: CPC (from Google Ads), CVR (your account conversion rate), and CLV/LTV (from your CRM or repeat-purchase data).
When to Use the LTV-Adjusted Formula
- Subscription or SaaS businesses with measurable churn and calculable LTV
- E-commerce with repeat purchase rates above 25% per year
- Service businesses with retainer or renewal revenue cycles
- Any business where Customer Acquisition Cost (CAC) is a tracked board-level metric
LTV/CAC Ratio: What the Numbers Mean
[SKYMOON INFOTECH ANALYSIS] The LTV/CAC ratio is the clearest signal for scaling decisions. A ratio of 3:1 means the business earns Rs 3 in lifetime value for every Rs 1 spent acquiring a customer.
Below 2:1, the unit economics do not justify scaling paid acquisition regardless of how the ROAS looks in the platform dashboard.
| Business Type | Healthy LTV/CAC | Red Zone (Stop Scaling) | Green Zone (Increase Budget) |
|---|---|---|---|
| SaaS / Subscription | 3:1 minimum | Below 2:1 | Above 4:1 |
| E-commerce | 2.5:1 | Below 1.5:1 | Above 3.5:1 |
| B2B Professional Services | 4:1 | Below 2.5:1 | Above 5:1 |
| Healthcare Lead Generation | 3:1 | Below 2:1 | Above 4:1 |
Payback Period
Payback period tells you how quickly the business recovers its customer acquisition cost. For subscription businesses, it is the most finance-legible metric for justifying increased PPC budget.
Payback Period Formula: Payback Period = CAC / Monthly Gross Margin per Customer | Example: CAC = $158 (total cost $9,500 / 60 customers). Monthly gross margin per customer = $79.20 ($99 x 80%). Payback = $158 / $79.20 = 2.0 months.
A payback period under 12 months is generally considered healthy for scaling. Above 18 months signals that either CVR improvement or cost reduction is needed before increasing budgets. For the LTV section of the calculator, payback period is auto-calculated when LTV inputs are provided.
Google Ads ROI Formula: How to Calculate It Correctly in the Platform
The roi formula in Google Ads (sometimes searched as “roi formula Google Ads” or “google ads roi formula”) is the same calculation, but the platform introduces two complications.
First, Google Ads reports ROAS (Revenue / Ad Spend), not ROI. Second, Google Ads uses last-click attribution by default, which overstates ROI for bottom-of-funnel campaigns.
To use the Google Ads roi formula correctly, import cost data into GA4 so it calculates all-in ROI rather than just ROAS. Switch attribution models to data-driven or linear before making scaling decisions.
And configure conversion values to reflect actual revenue or LTV, not a static estimated value set at account launch and never updated.
Google Ads Smart Bidding documentation notes that Smart Bidding strategies optimise toward the conversion goal you set. If that goal is configured with an inaccurate conversion value, every Smart Bidding decision is optimising in the wrong direction.
PPC ROI vs ROAS: When to Use Each Metric
| Metric | ROI | ROAS | Decision Rule |
|---|---|---|---|
| Formula | (Revenue – All Costs) / All Costs x 100 | Revenue / Ad Spend | — |
| Costs included | Everything: ad spend, fees, COGS, tools, labor | Ad spend only | — |
| What it answers | Is this campaign profitable? | Is this campaign revenue-efficient? | — |
| Best use case | Strategic: scale, pause, or reallocate channel budgets | Tactical: in-platform bid strategy (Target ROAS, Max Conversions) | — |
| Limitation | Requires accurate all-in cost tracking; slower to compute | Masks unprofitability; does not account for margin or overhead | — |
| Example | $20,000 revenue, $16,500 all-in costs = 21.2% ROI | $20,000 revenue, $5,000 ad spend = 400% ROAS | Same campaign, two different readings |
The clearest way to explain this to any stakeholder: a 400% ROAS can still be an unprofitable campaign. If the Rs 5,000 in ad spend is part of a Rs 16,500 all-in cost structure, the campaign delivers 21.2% ROI after costs.
Whether 21.2% is acceptable depends on what other channels deliver and what the cost of capital is. ROAS is the right metric for bid management inside the platform. ROI is the right metric for go/no-go scaling decisions and budget allocation across channels.
PPC ROI Average by Industry: 2026 Benchmark Data (Healthcare and Beyond)
When searching for ppc roi benchmarks 2026, the most important thing to understand before reading any benchmark table is that figures vary dramatically by vertical. The data below is healthcare-specific. Read the industry disclaimer before applying any figure to your own campaigns.
Important: industry disclaimer: The healthcare benchmark figures below are drawn from Skymoon-managed healthcare PPC campaigns and reflect the lead-generation dynamics of the healthcare vertical specifically. CTR, CPA, and ROI averages differ materially across other industries.
E-commerce, SaaS, professional services, and legal verticals have distinct cost structures, purchase cycles, and margin profiles that produce different benchmark ranges. Do not apply healthcare figures to campaigns in other sectors.
Skymoon Healthcare PPC Campaign Benchmarks (Observed Data)
[SKYMOON INFOTECH ANALYSIS] Across the healthcare PPC campaigns we have managed in the local lead-generation category, the following performance ranges represent what we consistently observe.
These figures reflect real campaign data from the healthcare vertical and are not modelled estimates.
| Metric | Observed Range | Strong Performance | Benchmark Month | Lowest Observed | Key Variable |
|---|---|---|---|---|---|
| CTR | 4.1% to 9.6% | Above 7% | 9.61% (observed peak) | 4.12% (observed low) | Ad relevance and match type tightening over time |
| CPA (INR, healthcare lead gen) | Rs 425 to Rs 814 | Below Rs 6,000 | Rs 6,006 (confirmed avg across 24 patients) | Rs 813 (form-fill CPA, broader funnel) | CPA differs significantly based on whether you count form fills or confirmed patients |
| Impressions per month | 10,329 to 49,810 | Depends on budget and geography | 49,810 (Jun 2025) | 10,329 (Oct 2025) | Budget level and campaign expansion decisions |
| Conversions per month | 18 to 40 | 30+ (for accounts of this scale) | 40 (Sep 2025) | 18 (Apr 2025 — first month) | Campaign learning curve: performance improves with data |
| Total spend vs conversions | Rs 1,44,136 spend / 240 leads / 24 patients | Rs 6,006 patient CPA | Rs 601 form-fill CPA (14,100 clicks to 240 leads) | 11.31x ROAS confirmed | Patient CPA is 10x form-fill CPA; understand which your campaign reports |
[*All benchmark figures are aggregated from approximately 5 anonymised Google Ads healthcare lead-generation campaigns managed by Skymoon Infotech. No campaign name, client, or location is identified. Data period: 2025-2026.]
The Healthcare PPC Funnel: Why the CPA Figure Depends on Where You Measure It
[SKYMOON INFOTECH ANALYSIS] The single most important thing to understand about healthcare PPC ROI is that what Google counts as a conversion is not the same as a patient. In the campaigns we have managed, this distinction changes the ROI calculation significantly.
In healthcare lead generation, the funnel has three distinct conversion stages. Google Ads typically reports the earliest stage as the conversion. The CPA you report depends entirely on which stage you count:
- Stage 1: Click to form fill. What Google Ads reports as a conversion. In the campaigns we have managed, form-fill CPA runs Rs 600-814 depending on audience and match-type configuration.
- Stage 2: Form fill to qualified lead (real contact, confirmed medical symptoms, appropriate for the service). In a highly specific speciality like endometriosis, a meaningful share of form fills come from people searching for related but non-qualifying conditions. The CRM data from campaigns we have managed shows this clearly: disqualification reasons included wrong geography, wrong condition, or inquiry by mistake.
- Stage 3: Qualified lead to booked patient (attended consultation or proceeded to a procedure). In the campaigns we track, the confirmed patient CPA is approximately Rs 6,006 on Rs 1,44,136 ad spend across 24 confirmed patients.
The ROI implications are significant. In the campaigns we manage, reported ROAS at the form-fill level was 11.31x (Rs 1,44,136 spend generating Rs 16.3L in attributed revenue). Of 240 leads generated, 88 qualified and 24 became confirmed patients.
Within those 24 patients, 2 proceeded to high-value procedures at Rs 8L each, contributing Rs 16L of the Rs 16.3L total attributed revenue. The surgery conversions drove the ROAS almost entirely. Standard form-fill ROI calculations would have reported a different, and misleading, picture.
[SKYMOON INFOTECH ANALYSIS] Healthcare PPC ROI is best calculated as: (Patient lifetime value x Confirmed patient conversions – Total campaign costs) / Total campaign costs.
Using form fills as the denominator with procedure revenue as the numerator produces a number that looks attractive but misrepresents the actual economics of the account.
Performance Trajectory: What the Data Shows
A pattern that appears consistently in healthcare lead-gen campaigns: CTR and CPA do not stabilise in the first 90 days. In the campaigns we have managed, opening CTR typically runs 4-6%, and stabilises above 8-9% after 6-9 months of match-type tightening, negative keyword expansion, and audience signal refinement.
The 11.31x ROAS in the campaign data above was achieved over a sustained optimisation period, not in the first month of running.
[SKYMOON INFOTECH ANALYSIS] The most significant CPA improvements in the healthcare campaigns we track consistently occur at two points: after the first major negative keyword expansion (typically at 60-90 days), and after audience exclusion lists are applied to remove intent signals that generate form fills but never convert to appointments. Both are optimisation levers that operate on campaign logic, not budget.
How Healthcare Benchmarks Compare to Other Verticals
Source: Source: WordStream by LocaliQ Google Ads Benchmarks 2026 (13,000+ US campaigns, April 2025-March 2026, published May 19 2026).
Cross-industry averages: 6.64% CTR, $5.42 CPC, 8.18% CVR, $66.69 CPL. Industry-specific figures below are from the same report.
ROI ranges are estimated from CPL and average deal values; not published directly by WordStream.
| Industry | Typical CTR (Google Ads) | Typical CPA Range | ROI Range (All-In Costs) |
|---|---|---|---|
| Healthcare (Lead Gen) | 4-10% (Skymoon observed) | Rs 400-900 India; $50-200 US | 150-350% |
| E-commerce (High Margin, 50%+) | 5.5-8.0% CTR / $2.69-3.50 CPC | 4.0-6.0% CVR / $45-65 CPL | 150-300% est. |
| E-commerce (Low Margin, <30%) | 5.5-8.0% CTR / $1.63-2.69 CPC | 2.5-4.5% CVR / $55-90 CPL | 50-120% est. |
| B2B SaaS (First-Year Revenue) | 4.5-7.0% CTR / $3.80-6.50 CPC | 5.0-9.0% CVR / $55-90 CPL | 200-500% first-year; 8-15x LTV |
| Professional Services / Legal | 4.24% CTR / $8.58-9.87 CPC | 5.5-8.0% CVR / $96-132 CPL | 300-600% est. |
| Education / Online Courses | 6.0-9.5% CTR / $2.40-4.50 CPC | 6.0-10.0% CVR / $40-70 CPL | 200-450% est. |
Healthcare PPC ROI: Worked Example from Real Campaign Data
The table below shows a worked example of PPC ROI calculation for a healthcare lead-generation campaign. All data is aggregated and anonymised. No client name, location, or identifying detail is used.
| Funnel Stage | Volume | Rate / KPI | Cost Basis | Notes |
|---|---|---|---|---|
| Ad Spend | Rs 1,44,136 | Google Ads only. No Meta or WhatsApp. | ||
| Impressions | 2,34,000 | |||
| Clicks | 14,100 | 6.03% CTR | Confirmed | |
| Leads (form fills) | 240 | 1.70% CVR | Rs 601 CPA at this stage | What Google Ads calls a conversion |
| Qualified Leads | 88 | 36.7% qual rate | Real contact, right symptoms, appropriate for service | |
| Appointments | 24 | 27.3% appt rate | Qualified lead to confirmed appointment | |
| Confirmed Patients | 24 | 10% lead-to-patient | Rs 6,006 patient CPA | Attended consultation |
| High-Value Procedures | 2 | 8.3% of patients | Rs 72,068 per procedure CPA | Rs 8L revenue each |
| Total Attributed Revenue | Rs 16,30,775 | 11.31x ROAS | Confirmed PPC-attributed revenue |
The 11.31x ROAS is confirmed from actual campaign data. The ROI depends on margin assumptions. The table below presents three planning scenarios using estimated contribution margins. These are scenarios, not audited profit figures.
| Scenario | Margin Assumed | Estimated Profit (2 Procedures) | ROI After Full PPC Spend |
|---|---|---|---|
| Conservative | 20% contribution margin | Rs 3,20,000 | 122% |
| Mid-point | 35% contribution margin | Rs 5,60,000 | 288% |
| Optimistic | 50% contribution margin | Rs 8,00,000 | 455% |
Important framing note: The margin scenarios above are planning assumptions only. They are not audited net profit figures. Actual net profit requires the practice internal clinical, staffing, facility, and overhead cost data.
What is confirmed and not an assumption: Rs 1,44,136 ad spend, Rs 16,30,775 attributed revenue, 11.31x ROAS, 24 confirmed patients, 2 high-value procedure conversions. Use these confirmed figures in your ROI discussions with leadership; use the scenarios only for planning.
How to Track PPC ROI Accurately: GA4, UTMs, and Offline Conversions
The calculation is only as reliable as the tracking underneath it. Three setup steps determine accuracy. For complete GA4 configuration, Google’s GA4 conversion setup documentation is the authoritative reference.
Step 1: Configure Conversion Values in GA4
Assign a monetary value to each conversion event that reflects actual revenue (or LTV for subscription businesses), not a static number set at account launch. For lead generation: use average deal size x close rate as the conversion value, updated quarterly as close rates shift.
Import Google Ads cost data into GA4 under Admin > Data Import so GA4 computes all-in ROI rather than only ROAS.
Step 2: UTM Parameters on Every Paid URL
Without consistent UTM tagging, GA4 cannot reliably attribute revenue to the correct campaign or ad group. The minimum UTM structure: utm_source=google | utm_medium=cpc | utm_campaign=[campaign_name] | utm_content=[ad_group_or_creative].
Auto-tagging handles GCLID for Google Ads internal attribution; UTMs handle cross-platform and CRM attribution.
One pattern worth noting from common PPC mistakes we see across accounts: broken UTM conventions, where campaign names contain spaces or inconsistent capitalisation, are the single most common cause of traffic appearing as “direct” in GA4 instead of “paid search.” Run a UTM audit before trusting any attribution report.
Step 3: Offline Conversion Import for B2B and Lead-Gen
For businesses where the conversion is a form fill and the revenue comes from a closed deal weeks later, last-click attribution systematically undercounts ROI for upper-funnel campaigns.
Import CRM closed-won revenue back into Google Ads as an offline conversion event. This is the only way to close the loop between an ad click in January and a signed contract in March.
PPC ROI Tracking Cadence
| Review Frequency | Account Type | What to Review |
|---|---|---|
| Weekly | Accounts spending above Rs 5L/month ($6k+) | Anomaly detection only. Do not make bid decisions from weekly ROI data — too much statistical noise. |
| Monthly | Standard operating cadence for all accounts | Compare 30-day trailing average to same period prior year. The primary ROI review. |
| Quarterly | Strategic channel comparison | Compare ROI across all paid channels. Assess LTV/CAC trends. Inform budget reallocation decisions. |
How to Prove PPC ROI to Your Leadership Team
When the question is how to prove ppc roi to leadership team, the answer is not a longer report with more PPC metrics. The metrics marketers default to reporting (CTR, CPC, impressions, Quality Score) are process metrics. Finance and leadership teams read in margin and capital efficiency language.
- Report profit contribution, not revenue. State margin-adjusted return: “The campaign generated X in gross profit against Y total cost.” Revenue figures are less actionable to a finance team because they do not distinguish high-COGS from low-COGS sales.
- Show the payback period. “We recover the customer acquisition cost in an average of 2.1 months, with the remaining LTV representing incrementally profitable revenue” is a finance-legible statement that any CFO will recognise.
- Use LTV/CAC ratio as your scaling argument. An LTV/CAC of 4:1 is the clearest signal that the acquisition channel deserves more budget. The Smart Goals and target-setting guide covers how to set the upstream conversion goals that feed this calculation.
- Compare to the next-best use of capital. A 200% PPC ROI is compelling or ordinary depending on what else the company could do with that money. Frame it against the alternative, not against an industry average.
How to Improve PPC ROI: The Four Levers
There are exactly four levers: reduce cost, increase CVR, increase AOV, and increase LTV. Everything else is a tactic within one of these four.
| Lever | Direct Action | Typical Impact | What to Watch |
|---|---|---|---|
| Reduce ad spend waste | Tighten match types; add negatives weekly; pause keywords with 10+ clicks and zero conversions | 15-30% cost reduction without revenue loss in most accounts | Do not over-restrict broad match before accumulating conversion data |
| Increase CVR | A/B test landing pages; match page message to ad promise; reduce form fields to 4 or fewer | 1% CVR lift typically doubles ROI at the same cost | Test one variable at a time; require 100+ conversions per variant for statistical significance |
| Increase AOV | Order bumps, bundles, upsell at checkout, free shipping thresholds | +10% AOV produces +10% ROI at the same cost and CVR | Upsell must feel like value, not friction, or it reduces CVR enough to cancel the AOV gain |
| Improve LTV | Retention flows, onboarding quality, subscription models where applicable | Highest leverage for repeat-purchase businesses; full impact takes 12-24 months | LTV improvements manifest slowly in ROI reporting; track cohort LTV separately from campaign ROI |
For accounts where wasted spend is the primary ROI drag, a structured review of common PPC mistakes in keyword management and match type selection is usually the fastest ROI improvement available before touching bids or landing pages.
For accounts where CVR is the constraint, Skymoon Infotech’s CRO service addresses the landing page and conversion funnel layer directly.
Frequently Asked Questions
How do I measure ROI in PPC advertising?
Use ROI = ((Revenue from PPC – Total Costs) / Total Costs) x 100. Total Costs must include ad spend, agency fees, creative production, tools, COGS for e-commerce, and in-house labor; not ad spend alone.
Track in GA4 with conversion values configured and cost data imported from the ad platform so the calculation reflects all-in profitability rather than ROAS.
What is a good PPC ROI?
It depends on margin, sales cycle, and LTV. Most accounts target 100-300% all-in ROI (returning Rs 2-4 or $2-4 per Rs 1 / $1 spent). High-margin services and SaaS typically run 200-500%. High-COGS e-commerce may find 50-120% acceptable.
In healthcare lead-generation campaigns we manage, confirmed ROAS has reached 11.31x with ROI scenarios ranging from 122% to 455% depending on contribution margin assumptions.
How do I calculate Google Ads ROI using customer lifetime value, conversion rate, and CPC?
Use: ROI = ((Clicks x CVR x LTV) – Total Costs) / Total Costs x 100. Where Clicks = Ad Spend / CPC, CVR is your conversion rate, and LTV = AOV x Purchase Frequency x Customer Lifespan x Gross Margin.
This LTV-adjusted method is appropriate for subscription, SaaS, and repeat-purchase businesses where single-sale ROI understates actual return.
What is the difference between ROI and ROAS?
ROAS = Revenue / Ad Spend. It measures revenue efficiency and ignores all costs except ad spend. ROI = (Revenue – All Costs) / All Costs x 100. It measures profitability after all costs.
A 400% ROAS at 40% gross margin and Rs 16,500 all-in cost against Rs 20,000 revenue produces approximately 21% ROI. Use ROAS for in-platform bid management; use ROI for scaling decisions.
How often should I calculate PPC ROI?
Monthly at minimum for standard accounts. Weekly for high-spend accounts to catch anomalies, but do not make bid decisions from weekly ROI data: too much statistical noise.
Review over 30, 60, and 90-day windows because conversions lag. For subscription businesses, track both month-1 ROI and LTV-projected ROI separately.
How can I prove PPC ROI to my leadership team?
Report profit contribution rather than revenue, show the payback period in months, and use the LTV/CAC ratio as your scaling argument.
Finance teams read margin and capital efficiency language, not CTR or impression share. Frame the campaign return against the next-best use of the same budget rather than against an industry average.
What percentage of revenue should I spend on PPC?
Work backwards from a target ROI and your LTV/CAC ratio rather than choosing a flat percentage.
Common guidance is 5-15% of revenue for established businesses, higher during acquisition-phase growth if the LTV/CAC ratio justifies it.
If LTV/CAC exceeds 4:1, there is typically a case for spending more. If it falls below 2:1, fix CVR before increasing spend.
Does hiring a PPC agency improve ROI?
Yes, when the fee is offset by reduced wasted spend and improved conversion rates. Always include agency fees in the ROI denominator.
In the healthcare campaigns we have managed, accounts consistently show CPA improvement over 6-9 months as negative keyword depth increases and audience signals accumulate.
The improvement must be measured against the all-in cost, including the management fee.
Ready to turn this into an actual growth plan?
Our team builds strategies across SEO, paid advertising, AI search visibility, and website performance, matched to your budget and your goals, not a generic package.
- A real thirty minute call, not a sales pitch
- Recommendations specific to your business
- A short list of what to fix first
Next Steps: Calculate Your PPC ROI and Close the Gap
If the gap between your reported ROAS and your calculated all-in ROI is significant, the most common causes are an undercounted denominator, a landing page conversion rate below your industry benchmark, or a customer lifetime value being counted as a single transaction.
Skymoon Infotech’s PPC management team runs full-funnel ROI audits that rebuild the calculation from the cost stack to LTV before making any campaign recommendations. For a free ROI audit of your current campaigns, book a consultation, and we will calculate where your current spend stands against both the standard and LTV-adjusted benchmarks for your vertical.
Let's turn this into results for your business.
SEO, paid advertising, AI search visibility, website design, and conversion optimization, all under one roof, all pointed at the same goal: revenue.